Nevados is a single axis tracker technology company. Our core product, the TRACE All Terrain Tracker features articulating technology enabling projects to be built on up to an unmatched 37% max slope. As the company has grown with over 2GWs in process, the need was clear for a sophisticated operational dashboard to meet the capabilities of the tracker and our customers’ needs.
Nevados contracted with Zentered, who built the Operations & Monitoring Dashboard for the TRACE All Terrain Tracker, from the ground up, starting in August 2022. The platform spans the full stack: an MQTT ingestion pipeline that receives telemetry from every tracker in the field, TDEngine as the time-series database purpose-built for high-frequency device data, a Fastify GraphQL API with row-level multi-tenant security, and a React dashboard designed for the people who run solar farms day to day.
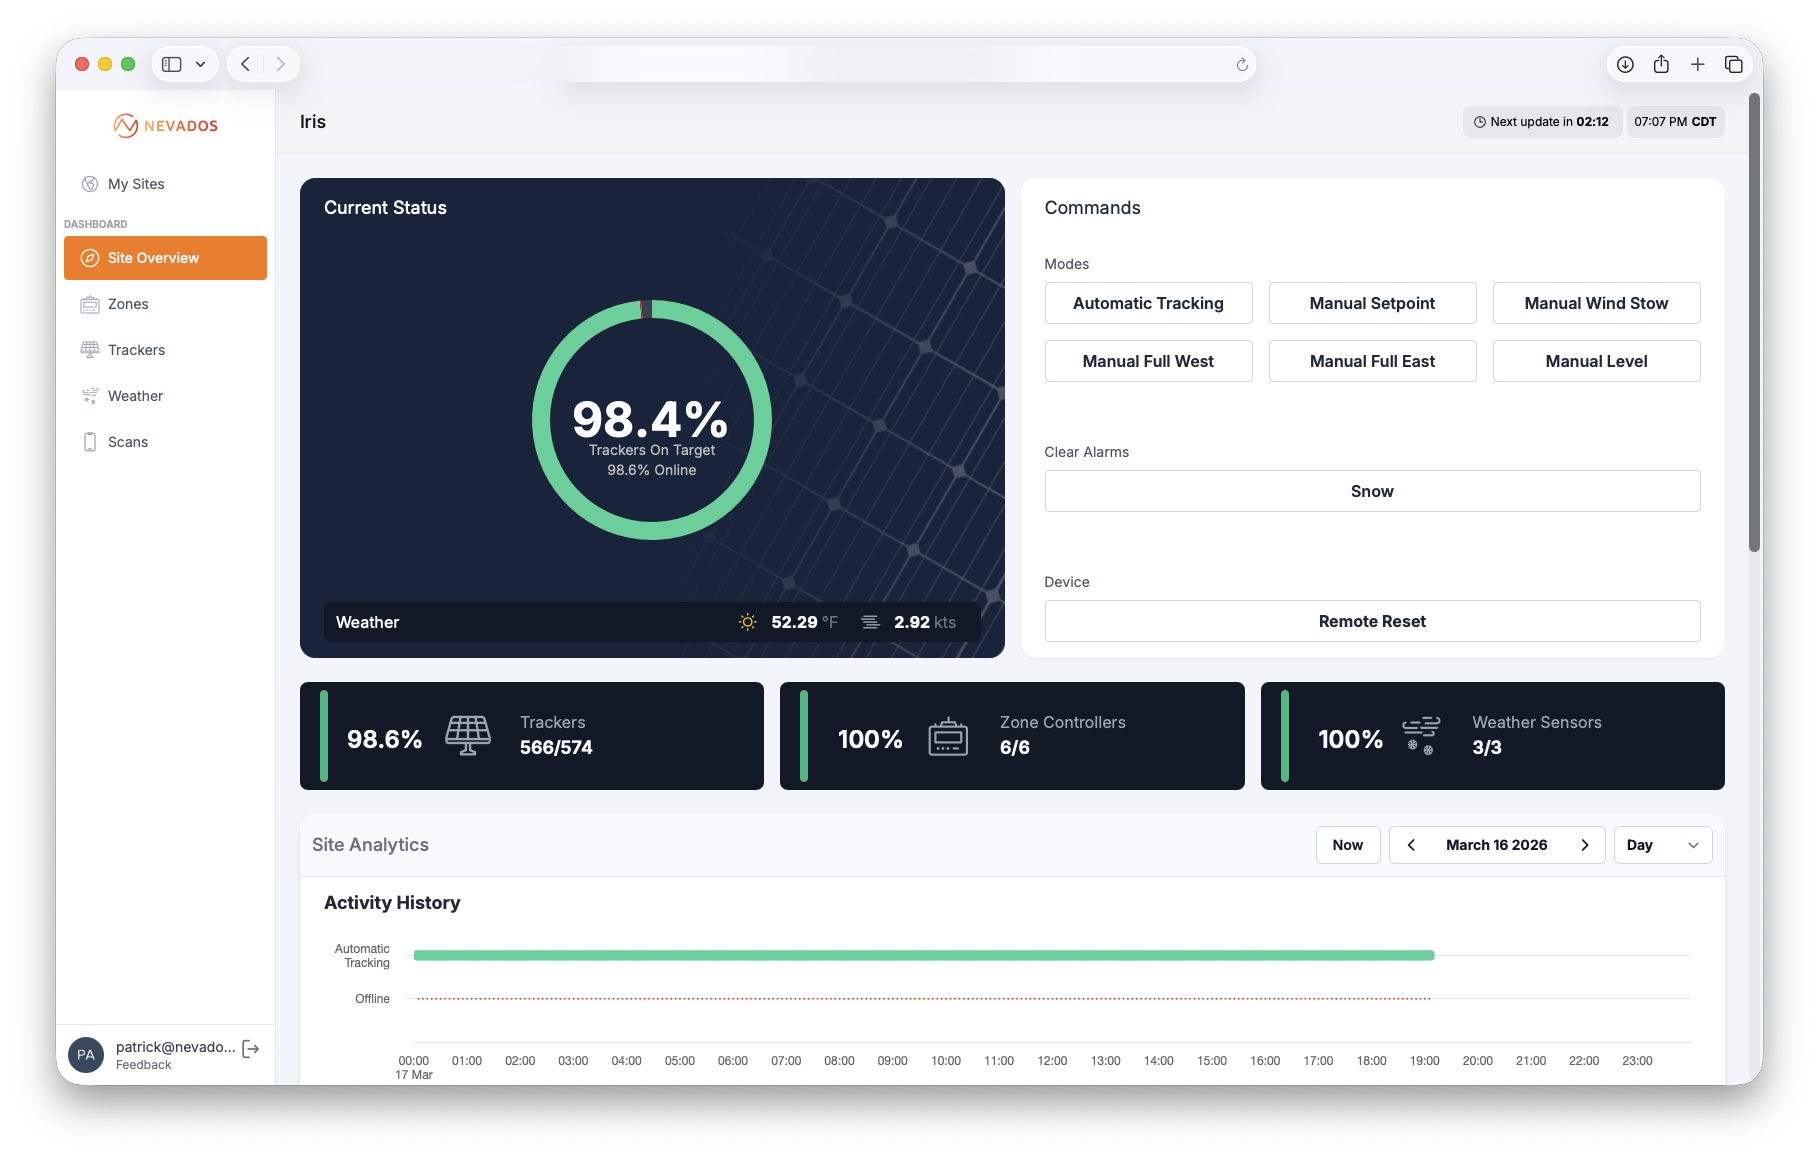
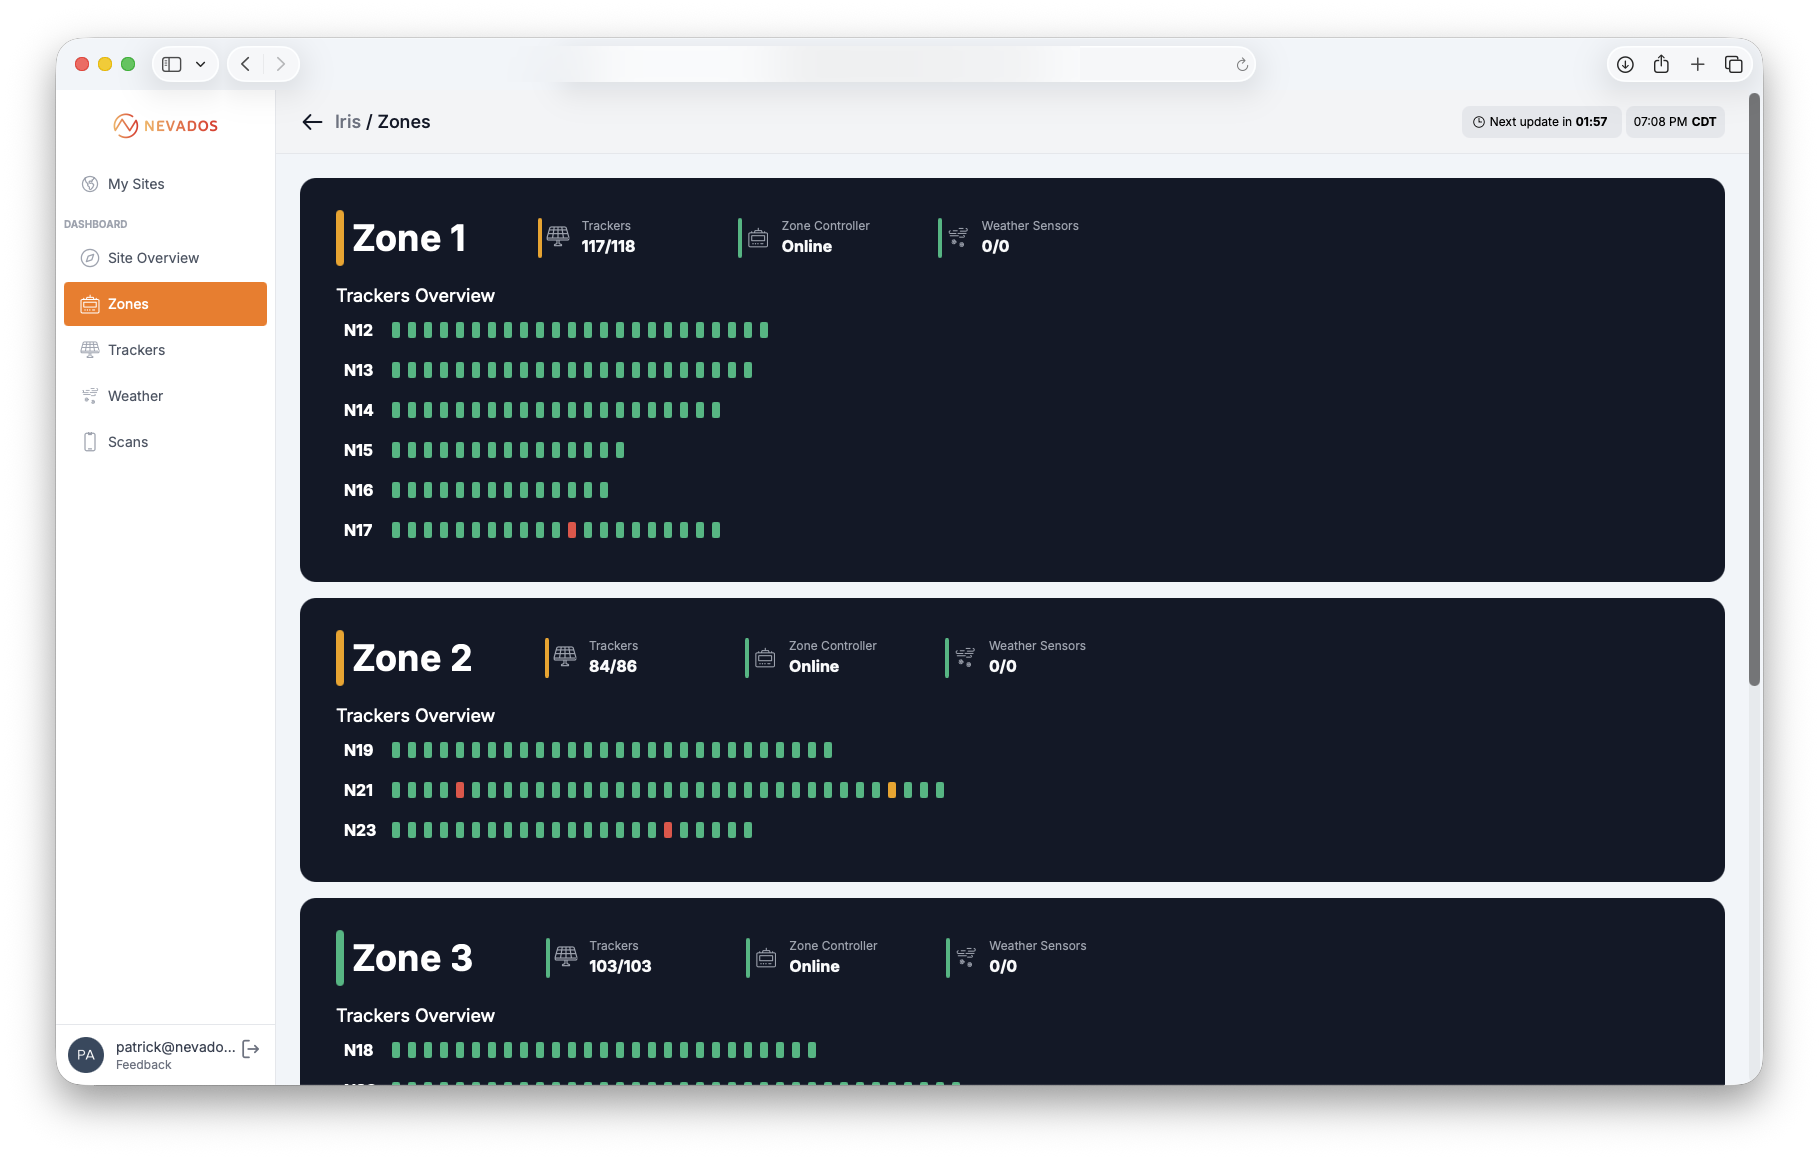
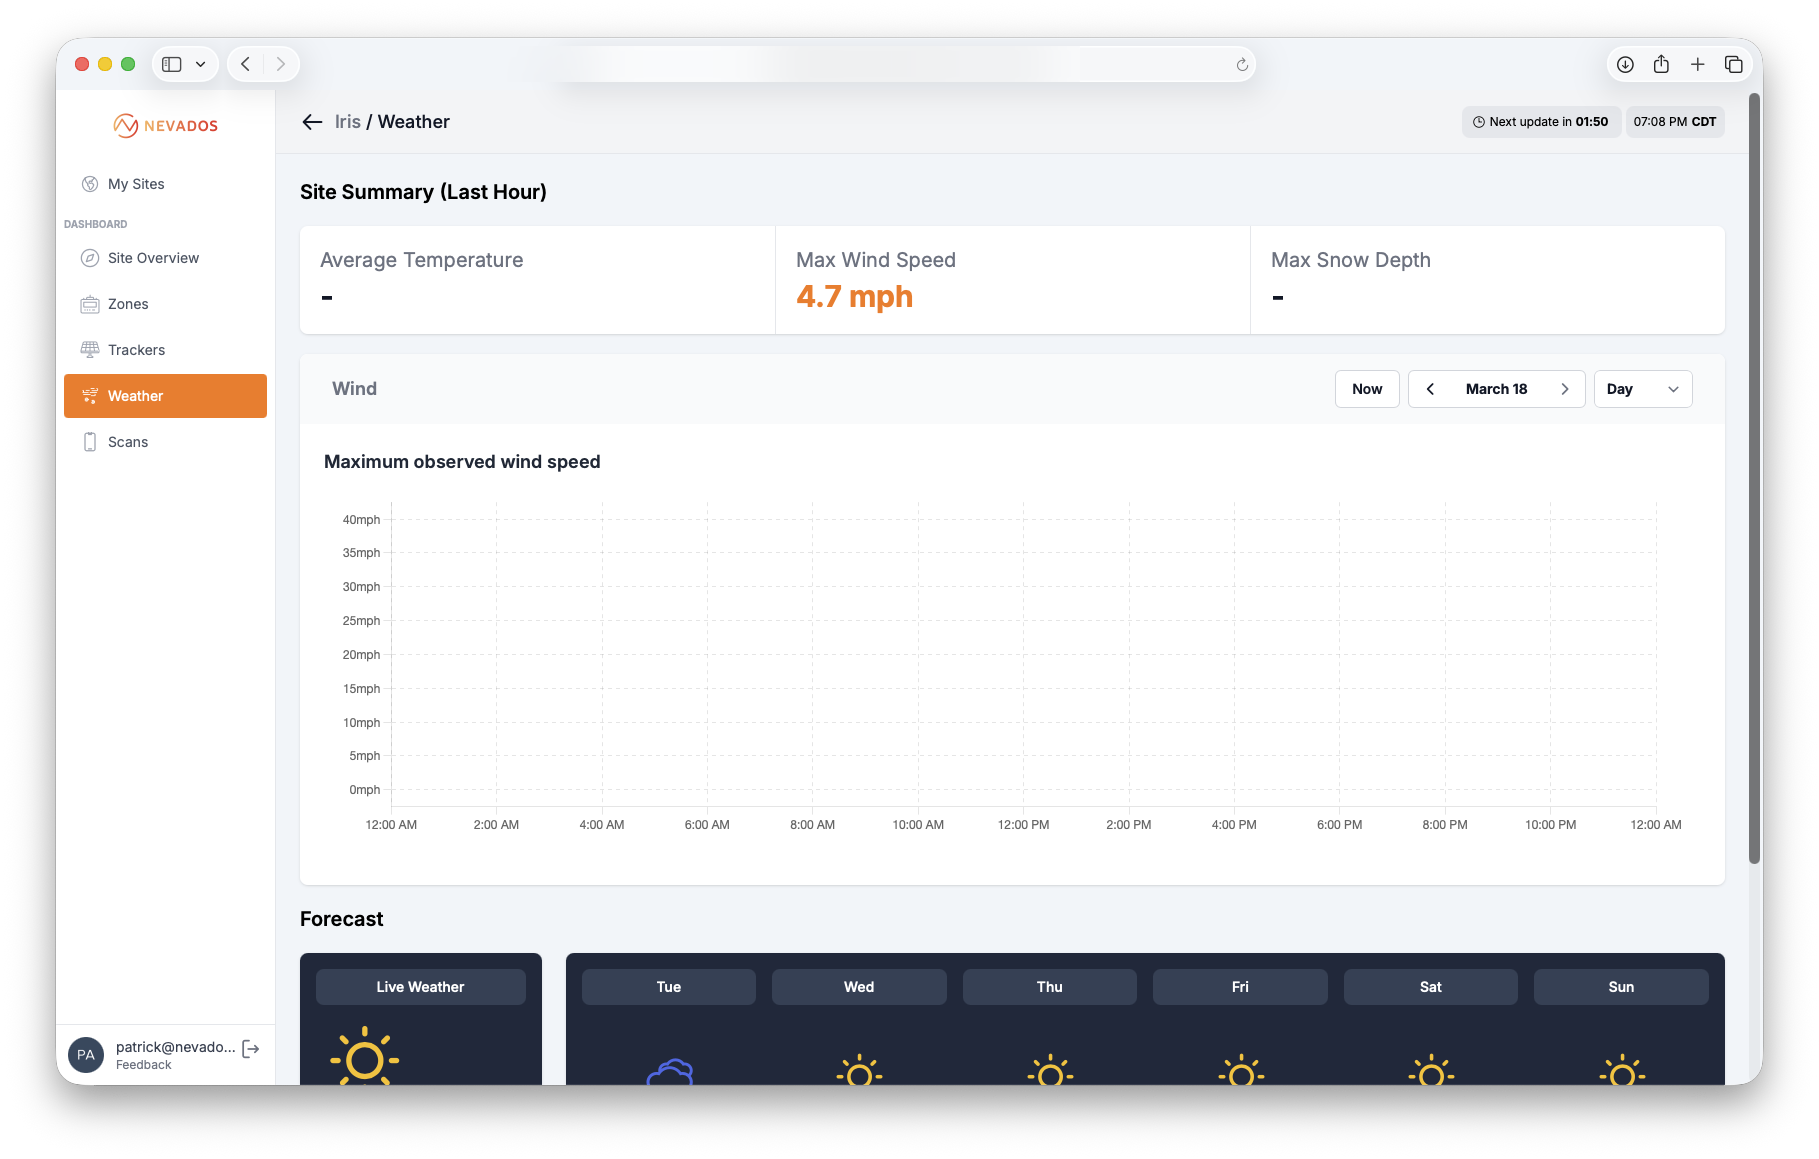
The result is a platform where operators can see the health of an entire site at a glance — what percentage of trackers are on target, how many zone controllers are online, whether weather sensors are reporting — and drill down to any zone or individual tracker when something needs attention. Commands like automatic tracking, manual wind stow, and remote device reset are available directly from the dashboard, reducing the time between spotting a problem and acting on it. The dashboard also gives the user manual control of the array for landscape maintenance activities for example.
Because Nevados operates across multiple customer organizations, the platform was designed as a multi-tenant system from day one. Each operator sees only their sites and their data, with access scoped per organization. As Nevados adds new customers and new sites, the platform scales without architectural changes.
Not only do customers find it useful, the platform is actively used by field operations teams across Nevados’s growing fleet of solar installations to actively manage and troubleshoot sites fully remotely — today monitoring over 1GW of operating Nevados solar capacity across the United States.
